Author

admin

Browsing

The publication was founded in 2001 by Russell Wassendorf, a notable executive in the futures brokerage industry who ran a large futures broker called Peregrine Financial Group.
 

SFOmag was mostly focused on the technical aspect of trading as opposed to fundamentals. Which made it pretty rare in that respect. There’s not really a popular publication today that caters to the technical, price-based trader. There’s much more money in reading the tea-leaves of months-old 13F filings and Elon Musk tweets, I suppose.

Who Wrote For SFO Magazine?

Given how many legendary names in the trading community contributed to SFOmag, it’s a real travesty they shutdown the way they did. 

The magazine featured notable contributors like: 

  • Larry Williams
  • Brett Steenbarger 
  • John J. Murphy 
  • Larry McMillan
  • Jack Schwager
  • Linda Bradford Raschke
  • Tom DeMark
  • John Bollinger
  • Steve Nison

A venerable who’s who of the trading community of 10-15 years ago. All still quite relevant. And yet almost none of it is available anymore.

Can You Still Read SFO Magazine?

Unfortunately, it doesn’t seem like any complete archive of the website exists anywhere. The Wayback Machine has some links archived but it’s very incomplete. Most of the magazine’s classic articles are within out-of-print physical magazines that may never see the light of day again.


However, old fans or simply curious traders can buy old issues of the magazine on eBay for pretty reasonable prices. You can also find copies of their out-of-print book series SFO Personal Investor on Amazon.


There’s a few editions of this series including an Online Trading edition, featuring interviews with Linda Bradford Raschke, John Carter, and William O’Neil. Further, there’s a trading psychology book featuring interviews with Van Tharp and Brett Steenbarger.


Linda Raschke has one of her 2005 SFO articles on here website here.

Why Did SFO Magazine Shut Down?

On the surface, you’d think SFOmag was simply a melting ice cube. An analog publication in a world that was aggressively pivoting to digital. But reality is much more grim.


In fact, SFOmag’s collapse had nothing to do with the profitability or performance of the magazine at all. 


You see, SFOmag was owned by financier Russel R. Wasendorf Sr., who also ran a large futures brokerage firm Peregrine Financial Group. Presumably, SFOmag was a tool to build Peregrine’s brand as a trusted futures broker.


But it turns out, Peregrine was a massive fraud. The story of the firm’s collapse was largely overshadowed by that of MF Global, another futures brokerage firm that cratered just months prior. 


Regulators discovered that Peregrine didn’t have the capital to fulfill customer withdrawal requests. The firm had been accepting customer deposits and not placing them with the bank, as required by regulators. Instead, CEO Wassendorf had been embezzling deposits. The National Futures Association found that $215 million in Peregrine customer deposits were missing, embezzled by Wassendorf.


Wassendorf attempted suicide outside of Peregrine’s Iowa headquarters in 2012, confessing to embezzling over a hundred million dollars in a note. DealBook reported:


Just nine days after his wedding, the local police found Mr. Wasendorf, the head of the firm, unconscious in his car behind the building with a tube running from the exhaust pipe into the car’s interior. An empty bottle of vodka rested by his side. He left a suicide note suggesting financial crimes had been committed.


Ultimately, Peregrine was forced into bankruptcy and shut down. Wassendorf was sentenced to 50 years in prison, which is effectively a life sentence at the age of 64. 


It took a long time, but it looks like Peregrine customers got most or all of their money back.


As for SFOmag, it was quickly sold in a fire sale to trading education website TraderPlanet, who ceased operations of the magazine.


The sale was announced via Twitter on July 10, 2012:


sfomag.PNG


The software provides traders with two key functions:

  1. The ability to design, backtest, and monitor strategies using free historical data.
     
  2. The ability to connect to select brokers and push through live trades so that you can monitor their performance in Option Net Explorer.


It is great for backtesting and perfecting trading strategies. It was made with the vision of allowing regular traders to have access to tools that professional traders demand.

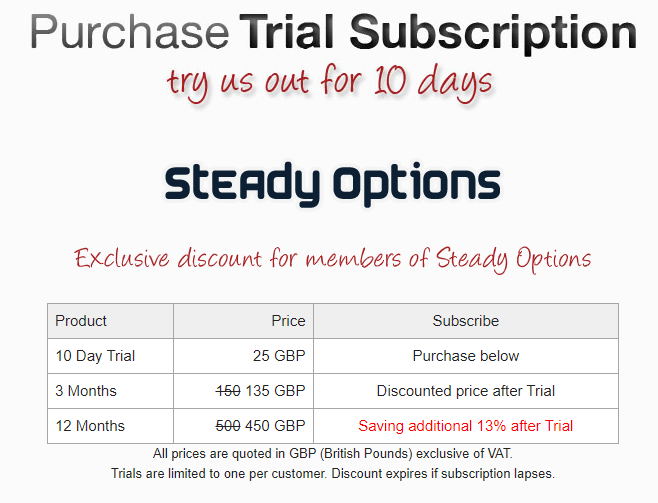
SteadyOptions readers can use this link to get a discounted free trial.

image.png

Click here to take advantage of this offer.
 

Some of the features of the Option NET Explorer software:

  • Historical market data for all optionable US Equities and Indices in 5 minute intervals within the platform.
     
  • All software upgrades during the term of your subscription.
     
  • Unlimited access to the support representatives via web, email and live chat.
     
  • Live/delayed data via thinkorswim, tradier or Interactive Brokers.
     
  • Send orders directly to the broker with more to be announced shortly.


You can watch below the Option NET Explorer software Presentation.


We are also pleased to offer the Option Net Explorer software for free to long term bundle members. Please find details below:

  • Members who sign up for the all services yearly bundle will get the ONE software for free for the first 12 months (~$700 value).
     
  • Members who are currently on yearly bundle subscription will get the software after their next renewal. If you want to upgrade from monthly or quarterly subscription, just wait to the end of your current term, cancel the current subscription and subscribe to yearly term.
     
  • The first 12 months are considered an extended free trial period. After that, you will be billed directly by ONE at SteadyOptions discounted rate of $450 GBP (around $600 USD).
     
  • This offer applies to new Option Net Explorer customers only. Existing or former ONE customers (including trial customers) are not eligible. Please do NOT sign up for ONE subscription if you intend to take advantage of this offer.


OptionNet Explorer provides option traders with an easy to use system for backtesting, designing and monitoring different strategies.
 

Option Net Explorer has import functionality, extensive reporting, and access to free data. It’s a valuable tool for any options trader seeking to trade regularly and increase their profitability.


Disclaimer: SteadyOptions team is using the OptionNET Explorer software and highly recommends it. SteadyOptions team does not receive any compensation from Option NET Explorer software provider for endorsing the OptionNET Explorer software.


This is the list of my favorite Options Trading books:


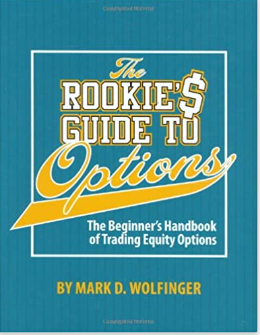
The Rookie’s Guide to Options by Mark D. Wolfinger

image.png


Learn to use options from veteran option trader Mark D. Wolfinger, who spent more than 20 years on the floor of the Chicago Board Options Exchange (CBOE). This was one of my first books on Options Trading. I consider Mark my mentor, and this book is still a must read.


Mark’s writing style is sensible, easy to understand, obsessively objective and thought provoking. He has a unique way of presenting obvious but frightfully neglected facts such as an admission that, he personally; does not possess the “skills” required to determine in advance where the market is going. This is definitely one of the best books for beginners.


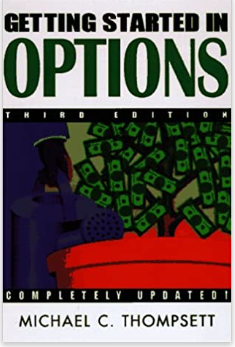
Getting Started in Options by Michael C Thomsett

image.png


An easy-to-read and updated guide to the dynamic world of options investing. This book is a good introduction to trading options directed primarily toward the novice trader. In non-technical, easy-to-follow terms, this accessible guide thoroughly demystifies the options markets, distinguishes the imagined risks from the real ones, and arms investors with the facts they need to make more informed decisions. 


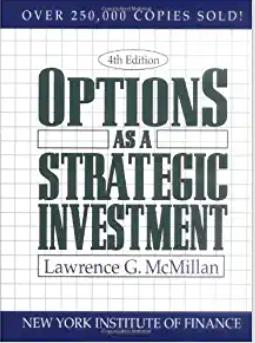
Options as a Strategic Investment by Lawrence G. McMillan

image.png


This guide is one of the most well-known and trusted books on options trading. This updated version of McMillan’s bestselling book contains all the essential information on options trading that you need to know to make intelligent investment decisions with confidence and success. A best-selling guide gives serious investors hundreds of market-tested strategies to maximize the earnings potential of their portfolio while reducing risk.


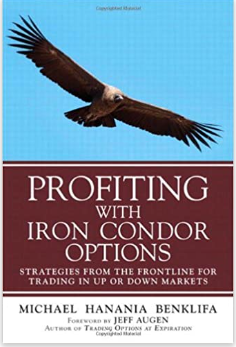
Profiting with Iron Condor Options by Michael Benklifa

image.png


In a straightforward approach, Hanania Benklifa provides readers the practical knowledge needed to trade options conservatively. The objectives are simple: make 2%-4% a month staying in the market as little as possible. A must read for all Iron Condor traders.


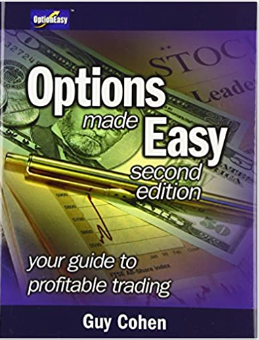
Options Made Easy by Guy Cohen

image.png


This book teaches all the essentials with real-life examples and crystal-clear explanations. No complicated math or confusing jargon: Learn visually with easy-to-understand pictures. Another excellent read mostly for beginners.


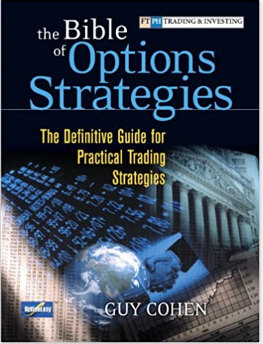
The Bible of Options Strategies By Guy Cohen

image.png


This is, quite simply, the most comprehensive, up-to-date, and usable guide to modern options trading strategies. Renowned options author and mentor Guy Cohen has brought together authoritative knowledge about every popular options strategy, for every type of trader and market environment. 


Cohen explains today’s 58 most valuable strategies, helping you consistently choose the right strategy and execute it effectively. You’ll learn each strategy’s goal, the market outlook and volatility factors that make it appropriate, its potential risks and rewards, and how proficient you should be to use it.


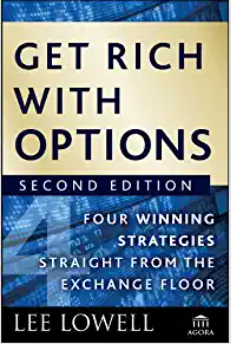
Get Rich with Options by Lee Lowell

image.png


Filled with in-depth insight and expert advice, this reliable resource provides you with the knowledge and strategies needed to achieve optimal results within the options market. It quickly covers the basics before moving on to the four options trading strategies that have helped Lowell profit in this arena time and again: buying deep-in-the-money call options, selling naked put options, selling option credit spreads, and selling covered calls.


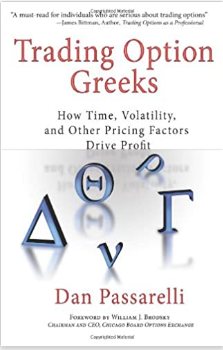
Trading Option Greeks by Dan Passrelli

image.png


To truly master options trading, one must cultivate a robust understanding of the “Greeks”. Passarelli’s book explains the impact that each of these factors has on option values, and presents various option trading strategies that seek to profit from changes in any or all of the “Greeks.” This lets traders accurately evaluate option pricing and identify profit opportunities.


This is one of the best options trading books for traders looking to not only understand what the options Greeks are — but also how to use them to your advantage.


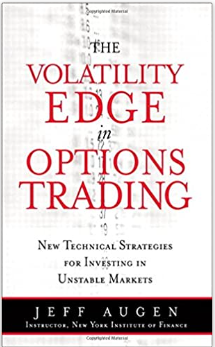
The Volatility Edge in Options Trading by Jeff Augen

image.png


This is not just another book about options trading. The author shares a plethora of knowledge based on 20 years of trading experience and study of the financial markets. Jeff explains the myriad of complexities about options in a manner that is insightful and easy to understand. Given the growth in the options and derivatives markets over the past five years, this book is required reading for any serious investor or anyone in the financial service industries. — MICHAELP. O’HARE


One of the strategies described in the book is called “Exploiting Earnings – Associated Rising Volatility”. I started implementing this strategy in my account, trading straddles and strangles on stocks before earnings. Those strategies became the cornerstone of SteadyOptions.


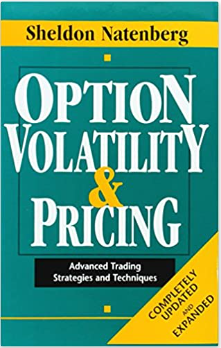
Option Volatility & Pricing by Sheldon Natenberg

image.png


In this options trading book, Natenberg covers everything from options trading basics to more advanced concepts like volatility and option pricing. This book does an excellent job of explaining the foundation of options theory and options trading concepts. It also provides a lot of practical advice, especially regarding risk management techniques. Overall, this book is perfect for those who want to deepen their understanding of the ins and outs of options trading.

Like this article? Visit our Options Education Center and Options Trading Blog for more.

Conclusion

90% of retail traders lose money in the stock market because they give up too quickly. Success in trading requires long term commitment, determination and discipline. It’s a journey, and hopefully those books can increase your chances to succeed in this journey.


A winning ratio is simply a number of winning trades divided by the total number of trades. For example, a trader who won 15 out of 20 trades would have a 75% winning ratio. A 90% winning ratio strategy in options usually refers to Out Of The Money credit spreads that have 90% probability to expire worthless. To achieve a 90% probability, you have to sell credit spreads with short deltas around 10.


Options Delta can be viewed as a percentage probability that an option will wind up in-the-money at expiration. Looking at the Delta of a far-out-of-the-money option is a good indication of its likelihood of having value at expiration. An option with less than a .10 Delta (or less than a 10% probability of being in-the-money) is not viewed as very likely to be in-the-money at any point and will need a strong move from the underlying to have value at expiration.


When you sell a credit spread with short deltas around 10, they have approximately 90% probability to expire worthless. So theoretically, you have a chance to have a 90% winning ratio.


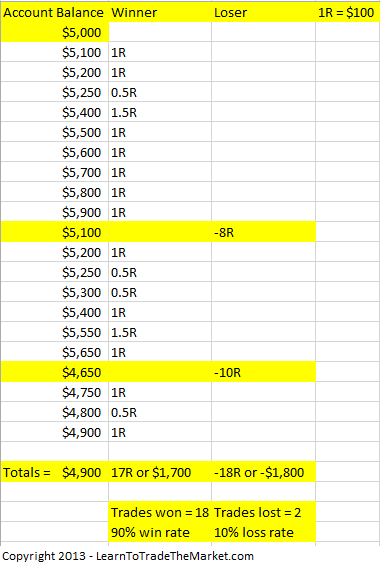
Here is the problem: when you have a 90% probability trade, your risk/reward is terrible – usually around 1:9, meaning that you risk $9 to make $1. Also with 90% probability trades, your maximum gain is usually limited to 8-10%, but your loss can be 100%. That means that you can have a 90% winning ratio, and still lose money. Also consider the fact that if you win 10% five times in a row and then lose 50%, you are not breakeven. You are actually down 25%.

The risk becomes even higher when you sell weekly credit spreads. With closer expiration, the Gamma Risk becomes much higher and the losses start to grow really fast when the underlying goes against you.


In the example image below, we can see that even with a 90% winning percentage, a trader can still lose money if they take losses that are too large relative to their winners:


saupload_winpercent1.png.33d128c7b9827fd


It should be obvious by now that a winning ratio alone doesn’t tell the whole story – in fact, it is pretty meaningless.

Here is how Karl Domm describes it:


And the key is this: you may be able to win 80-90% of your trade selling options in a bull or sideways market and even possibly in a grind down market.  In fact, you may be able to be profitable in those markets where your average winner with more occurrences outpaces the average loser with the lower occurrences for an overall gain, but what about the crash market?  


The last three crashes occurred on August 15,2015; February 5, 2018; and March 2020.  This is what your high win rate guru does not want to talk about.  They will avoid talking about a crash and they possibly never even experienced the crash or they never back tested their system through a crash.  They might not even know what’s going to happen in a crash or they’re just avoiding it altogether on purpose.  


Does it mean that credit spreads are a bad strategy? Not at all. But considering a winning ratio alone to evaluate a strategy is not a smart thing to do.


On the other side of the spectrum are traders who completely dismiss credit spreads due to their terrible risk/reward ratio. Here is an extract from an article by an options guru:


The truth is that OTM Credit Spreads have a high probability of making a profit. The average Credit Spread trader will face 100% losses on this trade several times a year while trying to make a modest 5 to 10% a month. What happens is that eventually most Credit Spread Traders meet their doomsday. Sooner or later, virtually all option traders who use only OTM Credit Spreads wipe out their trading accounts.
 

Let’s look at the “Computer Glitch” of 2010 when the DOW dropped 1000 points in a matter of minutes. Those doing Credit Spreads on this day lost on average between 70% and 90% of their portfolio. What happened is that the volatility rose drastically and the trades moved into that “danger zone” where they lose 100% 10 percent of the time. The Credit Spread trader doesn’t realize that the 10 percent of the time they lose can happen AT ANY TIME. Most people think that they will have 9 wins followed by 1 loss, but this obviously is not how the law of probability works. It’s not uncommon for an OTM Credit Spread trader to face a catastrophic loss on their very first trade, and once this happens, there is no way to recover since a winning trade will only bring back 10% on the remaining capital.”


While I agree that credit spreads are much riskier than most traders believe, the article ignores few important factors. It is true that credit spreads can experience some very significant losses from time to time. But this is where position sizing comes into play. Personally, I would never place more than 15-20% of my options account into credit spreads – unless they are hedged with put debit spreads and/or puts.


Overall, credit spreads and other high probability strategies can and should be part of a well-diversified options portfolio, but traders should concentrate on managing the strategy and the risk, and not on the winning ratio. In fact, many professional traders consider a 60% winning ratio excellent. For example, Peter Brandt admits that his winning ratio is only 43% – yet his Audited annual ROR is 41.6%. Many strategies are designed to have few big winners and many small losers.


The bottom line: the only thing that matters in trading is your overall portfolio return. A winning ratio simply doesn’t tell the whole story.

Related articles:


First, online banking allows for split-second transfers from one bank to another bank or financial institution. Second, unlike the Depression, this silent bank run has been gradual and lacks media coverage.
 

Until the last week, the silent bank run has not been about solvency concerns such as the Depression. Instead, customers moved money from banks to higher-yielding options outside the banking sector. The graph below from Pictet Asset Management shows that money market assets and domestic bank deposits have trended in opposite directions since the Fed started hiking interest rates. As a result of the silent bank run, banks must tighten lending standards and sell assets. This is already happening. To wit: “The primary loan market feels like a Scooby Doo ghost town – recently deserted and a bit haunted.” – Scott Macklin -AllianceBernstein. Because the economy heavily depends on increasing amounts of credit to grow, this silent bank run will likely lead to a recession.

silent bank run, The Silent Bank Run


Bull Market Is Back – Buy Signals Light Up

In early February, we recommended reducing exposure as all of the “sell signals” triggered.

“While that sell signal does NOT mean the market is about to crash, it does suggest that over the next couple of weeks to months, the market will likely consolidate or trade lower. Such is why we reduced our equity risk last week ahead of the Fed meeting.”

Of course, since then, the market did trade decently lower. However, with the rally yesterday as the “banking crisis” was laid to rest, the market not only confirmed the test of the December low support but rallied above key short-term resistance and triggered both our MACD and Money Flow “buy signals,” as shown.

The only challenge for the market between yesterday’s close and the February highs is the 50-DMA which is short-term resistance. The 200-DMA is now confirmed support. If the market breaks above the 50-DMA tomorrow, there is plenty of “fuel” for the market to push to 4200-4400.

silent bank run, The Silent Bank Run

Primary MoneyFlow Indicator Registers Buy Signal

silent bank run, The Silent Bank Run

We will be increasing exposure to portfolios fairly quickly, starting most likely tomorrow following the Fed announcement. The market is sniffing out a fairly dovish take from the Fed, so we will see if they are right.

Investor Conditioning vs. Reality

Lance Roberts leads his latest ARTICLE with a critical question.

“QE” or “Quantitative Easing” has been the bull’s “siren song” of the last decade, but will “Not QE” be the same?

Whether the latest bank bailout is technically QE or not, investors seem conditioned to believe that any Fed-related bailout is QE. If that holds this time, the latest jump in Fed assets, shown below, is probably bullish. In one week, the Fed offset over four months’ worth of QT. The second graph from the article shows the robust correlation between the growth of the Fed’s balance sheet and the growth of the S&P 500. While the economic outlook may not be good, liquidity or perceived liquidity can drive markets higher for extended periods.

silent bank run, The Silent Bank Run

silent bank run, The Silent Bank Run


Insuring All Deposits

The Fed and Treasury are contemplating guaranteeing the banking system’s $17.6 trillion of deposits. The problem is the FDIC only has $128b of capital. While insuring deposits may make sense, banks must raise capital to build the proper amount of FDIC insurance to cover all deposits. If the Treasury decides to insure deposits, will they issue trillions of debt to create a backstop? Or might they rely on funding from the market when the insurance is needed? Whether it’s larger deficit funding or capital funding from banks, the effects are concerning.

silent bank run, The Silent Bank Run


High Two-Year Note Volatility May Stick Around

As shown below, the two-year note recently fell by about one percent over the last few weeks. A crisis of sorts accompanied each prior significant decline. If you notice, the large declines tend not to be one-time moves. Volatility tends to stick around. Thus, the recent decline is likely not the last big move up or down. Rate volatility may be here to stay for a while.

silent bank run, The Silent Bank Run
 

silent bank run, The Silent Bank Run


Michael Lebowitz, CFA is an Investment Analyst and Portfolio Manager specializing in macroeconomic research, valuations, asset allocation, and risk management. Michael has over 25 years of financial markets experience. In this time he has managed $50 billion+ institutional portfolios as well as sub $1 million individual portfolios. Michael is a partner at Real Investment Advice and RIA Pro Contributing Editor and Research Director. Co-founder of 720 Global. You can follow Michael on Twitter.

Options provide investors with the ability to proactively hedge their portfolios against potential market crashes. In this article, we will discuss the importance of being proactively hedged in an options portfolio.


Why to Hedge?

One of the most critical reasons why it is important to be proactively hedged in an options portfolio is that it is too late to hedge once a market crash has already started.

When a market crash occurs, the prices of stocks plummet, and investors suffer significant losses. The time to hedge your portfolio is before the crash occurs, not after. Proactive hedging involves taking steps to protect your portfolio before the market downturn occurs.

Proactive hedging involves purchasing options that will benefit from a market downturn. These options are typically put options, which give the holder the right to sell an underlying asset at a predetermined price.

When the market crashes, the value of these put options increases, offsetting the losses incurred in the underlying stock. Another reason why it is important to be proactively hedged in an options portfolio is that it can help reduce the overall risk of the portfolio.

By purchasing put options, investors are essentially buying insurance against potential market downturns. While the cost of these options can be significant, they can provide a significant return on investment if a market crash occurs. In essence, proactive hedging is a form of risk management that can help protect investors from significant losses.


Furthermore, proactive hedging can also help investors take advantage of market opportunities. When the market is in a downturn, there are often opportunities to purchase stocks at discounted prices. By hedging their portfolios, investors can protect themselves against losses while still having the capital available to take advantage of these opportunities.
 

The Collar

There is a well known technique used to be proactively hedged while looking to profit. This technique is called the “collar” strategy. 


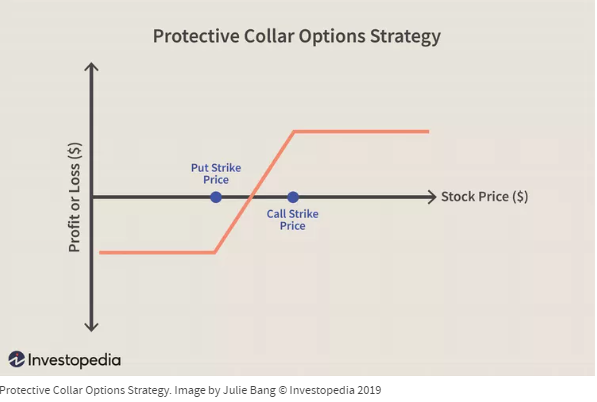
This strategy involves simultaneously purchasing put options to protect against downside risk while selling call options to generate income. The income generated from selling the call options can be used to finance the purchase of the put options, effectively creating a “collar” around the portfolio.


A collar is a trading strategy that is commonly used to limit the potential loss of an underlying asset while also capping its potential profit. It is created by combining a long position in an asset with a protective put option and a short call option.

image.png


While a collar can be an effective way to protect an investor’s position in the market, there are several weaknesses to this trade structure. Here are a few examples:

  1. Limited Profit Potential: One of the main weaknesses of a collar is that it limits the potential profit that an investor can make. By using a protective put option and a short call option, the investor is essentially giving up some of their potential gains in exchange for protection against losses. While this may be a smart move in certain market conditions, it can also be a hindrance in others.
     
  2. Costly to Implement: Another weakness of a collar is that it can be expensive to implement. This is because the investor must pay for both the protective put option and the short call option. Depending on the price of the underlying asset and the specific options being used, this cost can add up quickly.
     
  3. Requires Active Management: A collar also requires active management in order to be effective. This means that the investor must be constantly monitoring the market and their position in order to make informed decisions about when to adjust the collar. This can be time-consuming and stressful for some investors.
     

The Alternatives

The collar strategy, while well-known, has some weaknesses that can limit an investor’s potential gains and require active management. However, there are lesser-known strategies that can achieve the goal of proactively hedging without these downsides. These advanced techniques involve combining ratio spreads with butterflies and relying on second-order Greeks. As a result, these strategies offer several advantages, including:
 

  1. Greater Flexibility: These advanced strategies are more flexible than the collar strategy, allowing for more nuanced adjustments to an investor’s position in response to changing market conditions.
     
  2. Lower Cost: These strategies are less expensive to implement than the collar strategy, which can require the purchase of both a protective put option and a short call option.
     
  3. Potential for Higher Gains: By relying on second-order Greeks and combining ratio spreads with butterflies, these strategies have the potential for higher gains than the collar strategy.
     
  4. Reduced Need for Active Management: These advanced strategies can require less active management than the collar strategy, which can be a benefit for busy investors or those who prefer a more hands-off approach.

While the collar strategy has its place in certain market conditions, there are advanced options trading strategies that can offer several advantages over the collar strategy. These techniques are worth exploring for investors who are interested in proactively hedging their positions while also maximizing their potential gains.
 

Conclusion

In conclusion, investing in the stock market can be risky and unpredictable, but options trading can provide a way to proactively hedge against potential market crashes.

Being proactively hedged involves taking steps to protect your portfolio before a market downturn occurs. The collar strategy is a well-known technique used for proactively hedging, but it has some weaknesses that can limit an investor’s potential gains and require active management. However, there are advanced options trading strategies that can offer greater flexibility, lower cost, potential for higher gains, and reduced need for active management.

Ultimately, investors should  consider all options trading strategies to find the one that best suits their risk tolerance, investment goals, and market conditions. By proactively hedging their portfolios, investors can reduce their risk exposure, take advantage of market opportunities, and potentially achieve higher returns.


About the Author: Karl Domm’s 29+ years in options trading showcases his ability to trade for a living with a proven track record. His journey began as a retail trader, and after struggling for 23 years, he finally achieved 
consistent profitability in 2017 through his own options-only portfolio using quantitative trading strategies.

After he built a proven trading track record, he accepted outside investors. His book, “A Portfolio for All Markets,” focuses on option portfolio investing. He earned a BS Degree from Fresno State and currently resides in Clovis, California. You can follow him on YouTube and visit his website real-pl for more insights.


When I first started trading, online brokers were just starting to emerge, and my choices were limited. I remember spending hours watching CNBC, trying to absorb as much information as possible. I was convinced that if I could just get the inside scoop on why a stock was going up, I could make a killing in the market.


But as I began to delve deeper into the world of trading, I quickly realized that there was more to it than just listening to rumors and following the latest trends. I discovered that there were different styles of trading, one of which was called fundamental analysis. This approach involved looking at a company’s financials and stories around the company to make investment decisions.


Despite my new-found knowledge, my first few trades were disastrous. I would buy a stock based on a tip or a hunch, only to watch it plummet in value shortly after. I had no plan in place for what to do if things went south, and no idea when to sell if things went well. I was just diving in blindly, hoping for the best.


Today, I am a successful online trader, but it took a lot of trial and error to get here. I went through fundamental analysis then technical analysis until I finally became a quantitative trader. I learned that trading is not a get-rich-quick scheme, but a long-term game that requires discipline, patience, and a willingness to learn from your mistakes.


Making the decision to get started with online trading can be challenging, but it can also be a rewarding experience if approached with the right mindset and preparation. Here are some tips to help you make an informed decision:

  1. Educate yourself: Before diving into online trading, it’s important to educate yourself on the basics of investing, such as the different types of securities, risk management strategies, and trading psychology. There are many online resources and courses available that can help you build a strong foundation of knowledge and skills.
     
  2. Start small: It’s always wise to start small and test the waters before investing a significant amount of money. Consider opening a practice account or using a simulator to simulate trading in real markets without risking real money. This will help you get comfortable with the trading platform and the process of trading.
     
  3. Choose the right online broker: Choosing the right online broker is critical to your success as a trader. Look for brokers that offer competitive pricing, user-friendly trading platforms, and a wide range of investment options.
     
  4. Develop a trading plan: Before making any trades, develop a trading plan that outlines your goals, risk tolerance, and investment strategy. A trading plan can help you stay disciplined and focused on your long-term objectives, and can help you avoid impulsive decisions based on emotions or market volatility.
     
  5. Stay disciplined: Successful trading requires discipline, patience, and a willingness to learn and adapt. Avoid the temptation to make impulsive trades based on emotions, and stay focused on your trading plan and long-term objectives.

Remember, trading carries a level of risk, and it’s important to approach it with caution and discipline. With the right mindset and approach, online trading can be a rewarding experience that can potentially generate extra income and help you achieve your financial goals.


As for how much money you need to get started, the amount can vary depending on your goals, trading style, and risk tolerance. Some online brokers allow you to open an account with as little as $0 or $100, while others may require a minimum deposit of $1,000 or more. However, keep in mind that the amount you invest should be money that you can afford to lose, and that you should never invest more than you’re willing to lose.


In terms of software, most online brokers provide their own trading platforms that you can use to place trades, analyze risk, and monitor your portfolio. These platforms usually offer a range of features and tools that can help you make informed trading decisions, such as real-time market data, customizable charting tools, and research resources.


Some popular online brokers that you may want to consider include:

  • Robinhood
  • E*TRADE
  • TD Ameritrade
  • Charles Schwab
  • Fidelity

Before choosing a broker, it’s important to do your research and compare different options to find the one that best meets your needs and preferences. I personally like TD Ameritrade’s Think or Swim platform.


Additionally, I would recommend educating yourself on the basics of stock trading, including fundamental and technical analysis, risk management, and trading psychology. Even if you become a quantitative trader, it is good practice to understand the other styles in order to understand why not to do something. There are many online resources and courses available that can help you build a strong foundation of knowledge and skills.


Each trading style has its own set of challenges and obstacles to overcome. Fundamental analysis, for instance, relies heavily on news stories and can be heavily influenced by hedge funds and their advanced algorithms. By the time a retail trader hears about a stock’s potential, the price may have already been affected, making it difficult to make a profitable trade.


Directional trading, on the other hand, involves trying to predict the future direction of a stock. This can be a tricky business as even if the direction is correct, money management can play a significant role in the ultimate outcome of the trade.


Technical analysis is another popular approach, but it too can be directional dependent and come with similar challenges as described above.


Quantitative trading, however, offers a unique solution by eliminating the need to predict the direction of a stock. By using a proven edge such as the theta decay of options, traders can quantify their results without having to make directional predictions. This approach allows traders to focus on a proven system and remove much of the guesswork from the trading process, potentially leading to more consistent profits.


Remember, trading requires discipline, patience, and a willingness to learn. With the right mindset and approach, you can make informed trading decisions and potentially achieve your financial goals.


About the Author: Karl Domm’s 29+ years in options trading showcases his ability to trade for a living with a proven track record. His journey began as a retail trader, and after struggling for 23 years, he finally achieved 
consistent profitability in 2017 through his own options-only portfolio using quantitative trading strategies.

After he built a proven trading track record, he accepted outside investors. His book, “A Portfolio for All Markets,” focuses on option portfolio investing. He earned a BS Degree from Fresno State and currently resides in Clovis, California. You can follow him on YouTube and visit his website real-pl for more insights.


For example, if the SPDR S&P 500 ETF (SPY) trades at $396 per share, we expect a significant move in the S&P 500. Still, we’re unsure of the direction of said move. We might purchase an at-the-money (ATM) straddle, which involves buying an ATM put and call.


In this case, we’d buy the following options:

  • BUY 1 396 Put @ $8.06
     
  • BUY 1 396 Call @ 9.31
     
  • Total trade cost: $17.37 (net debit)


As you can see, in buying both an at-the-money put and call, we profit from significant price moves in either direction. However, this comes at a high cost, as you can see by the considerable premium outlay of $17.37, accounting for a bit more than 4% of the total underlying stock price. For this reason, we’d need a significant move in SPY for our position to show a profit.
 

Characteristics of a Long Straddle

The Long Straddle is Market Neutral

A long straddle is a market-neutral option spread, meaning it makes no attempt to predict the future price of the underlying stock. Instead, the idea is to profit from a significant price move in the underlying stock, regardless of whether it moves up or down.


For example, let’s say we purchase the long straddle on SPY that we referenced in the introduction to this article:


SPY Long Straddle:

  • BUY 1 396 Put @ $8.06
     
  • BUY 1 396 Call @ 9.31
     
  • Total trade cost: $17.37 (net debit)


If the price of SPY soars over the month, our call option will become profitable, and we can sell it for a profit. The reverse is true for our put option. In either case, we will make money if the price move is more significant than the price of the options we purchased.


While some traders prefer to forecast the price of stocks using technical or fundamental analysis, many seasoned options traders take solace in not having to predict where the price will be next month to make money in the markets.


A market-neutral strategy like the long straddle instead forecasts the future implied volatility of a stock. Maybe that just seems like a different type of prediction. There’s good reason to believe predicting future volatility is more manageable than forecasting future price direction.


While stock prices can go seemingly anywhere, volatility pricing is much more rhythmic. There’s considerable academic evidence that volatility clusters in the short term and mean-reverts over more extended periods. In other words, there’s a discernable pattern to market volatility that shrewd traders can profit from.


The Long Straddle is Long Volatility

Being “long-volatility” in the options market is synonymous with being a net buyer of options, or simply, “long options.” The critical aspect is that the long straddle is a play on volatility rather than price, making the trade vega positive.


In the options market, an at-the-money (ATM) straddle best represents the options market’s estimation of future volatility, also known as implied volatility. An easy way to escape all the jargon and technical minutia of the options world is to think of the ATM straddle as the over/under on volatility for that stock.


Allow me to explain. Let’s return to our example in the S&P 500 ETF (SPY). To remind you, here is the ATM straddle pricing for options expiring in 25 days:


SPY Long Straddle:

  • BUY 1 396 Put @ $8.06
     
  • BUY 1 396 Call @ 9.31
     
  • Total trade cost: $17.37 (net debit)


With our trade cost at $17.37, SPY has to move at least $17.37 in either direction within 25 days for us to profit from this trade. Is that a lot or a little? This is where your trading skills come in.


Options traders use a variety of factors to determine if a straddle is appropriately priced, including where implied volatility is today compared to its historical range, their technical analysis view, how they think the market will react to upcoming events like Federal Reserve meetings, and so on.
 

Long Straddles Have Defined Risk

Because the long straddle involves buying a put and call, the maximum risk is defined. It’s simply the combined cost of the two options. This provides a significant advantage, as you can be absolutely sure of your worst-case scenario in a long straddle.


Unlike short options strategies, like the short straddle, which have unlimited and undefined maximum risk levels.


For this reason, long straddles are often some of the first spreads that novice options traders begin to experiment with beyond simply buying single puts or calls. It’s just like what they’re used to doing, except it removes the directional element.


Returning to our SPY example from before, the max we can lose in this scenario is $17.37.
 

The Long Straddle Has Unlimited Profit Potential

The long straddle has theoretically unlimited upside profit potential. This means that if the underlying stock makes a big move in either direction, nothing stops your profits from going on forever, except the stock price goes to zero on the downside.


The Long Straddle Suffers from Time Decay (Short Theta)

When you buy options, you’re betting against the clock. The underlying stock must make your desired move before it expires, or else the option will expire worthless. This concept is known as “time decay,” or the more technical term, “theta decay.”


Theta is the Options Greek which measures an option position’s exposure to the passage of time. The great thing about the options Greeks is you can mathematically derive them. So you know exactly how much an option position will lose per day from the passage of time if all things remain equal.


If we return to our SPY long straddle example:


SPY Long Straddle:

  • BUY 1 396 Put @ $8.06
     
  • BUY 1 396 Call @ 9.31
     
  • Theta: -0.34
     
  • Total trade cost: $17.37 (net debit)


The position has a theta of -0.34, meaning the position will lose about $0.34 in value per day until expiration. Keep in mind that theta changes over the life of an option. As expiration nears, the value of theta declines, as there is less time value in the option.


So the daily decay will be lower in absolute terms. Still, it can often be higher in terms of the percentage of the position’s value if the underlying stock hasn’t moved in your favor. The following chart from Investopedia should put things into perspective:
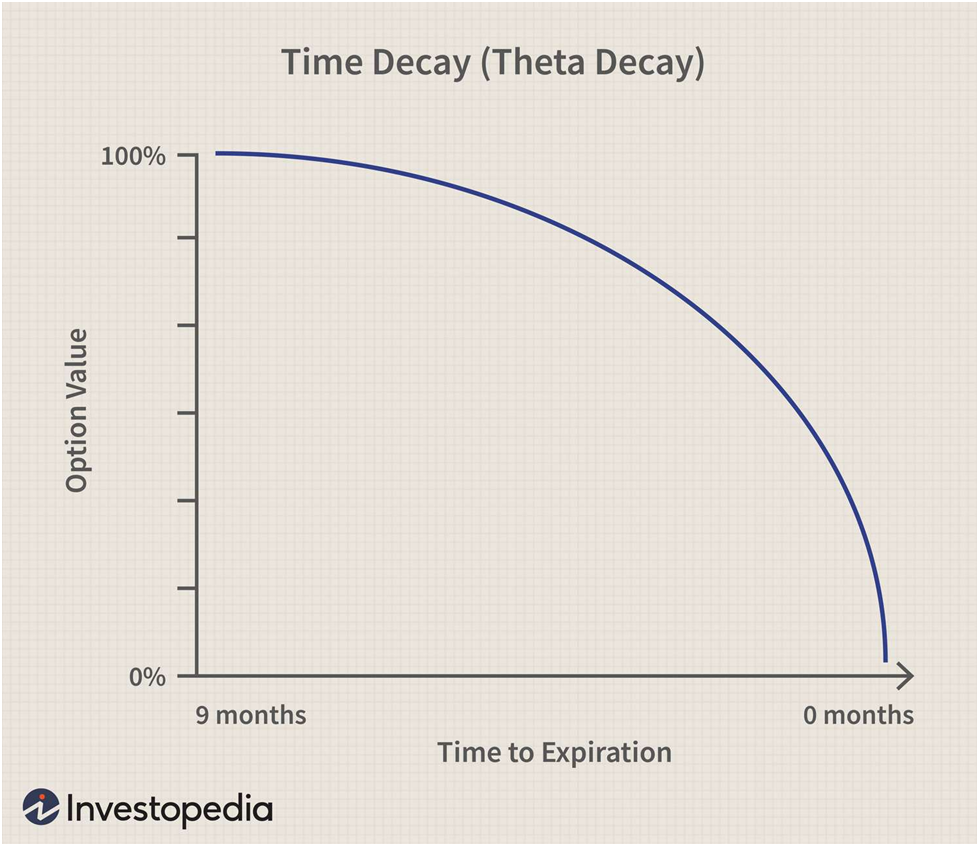
 

image.png

Source: Investopedia


How to Create a Long Straddle position

The long straddle is one of the simplest options spreads out there. It just consists of a long put and call. Here’s what a long straddle might look like on an options chain:
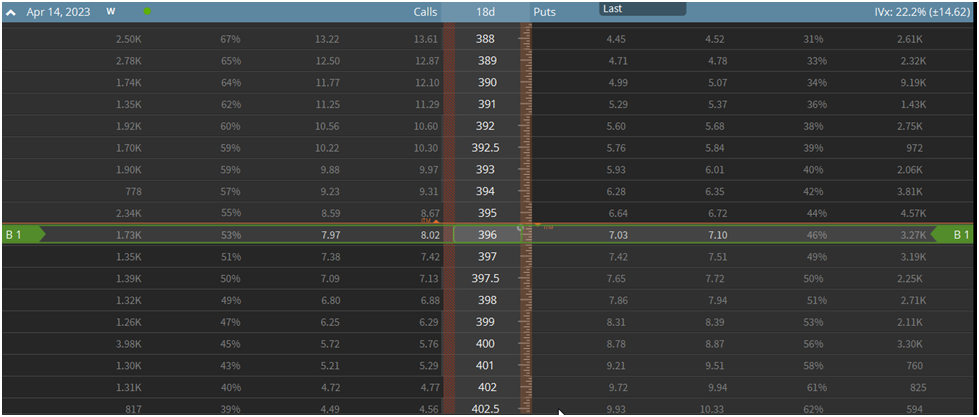
 

image.png


As you can see, we’re buying a put and call at the same strike at the same expiration. The above example shows an at-the-money (ATM) straddle. However, you can structure a straddle to better fit your market view.


For instance, if we move the strike price of our straddle higher, it’ll become more profitable on the downside quicker and take a more significant price move for it to become profitable on the upside. The opposite of this is also true.


Long Straddle Payoff and Max Profit/Loss

Long Straddle Breakeven Prices

The long straddle is very easy to calculate breakeven, max profit, and max loss levels for. This is another reason it’s an excellent spread for novices to begin to dip their toes in options spread trading.


As an example, we’ll use our SPY long straddle again and calculate the various levels for it:


SPY Long Straddle:

  • BUY 1 396 Put @ $8.06
     
  • BUY 1 396 Call @ 9.31
     
  • Theta: -0.34
     
  • Total trade cost: $17.37 (net debit)


To calculate the upper breakeven price for a long straddle, simply add the total premium paid to the strike price. In this case, you simply add $396 + $17.37 = $413.37. Our upper breakeven price is $413.37.


The lower breakeven price for a long straddle is equally easy to calculate. You simply subtract the total premium paid from the strike price. In this case, that is $396 – $17.37 = $378.63.


To contextualize these prices, I’ll plot them on a chart of SPY:
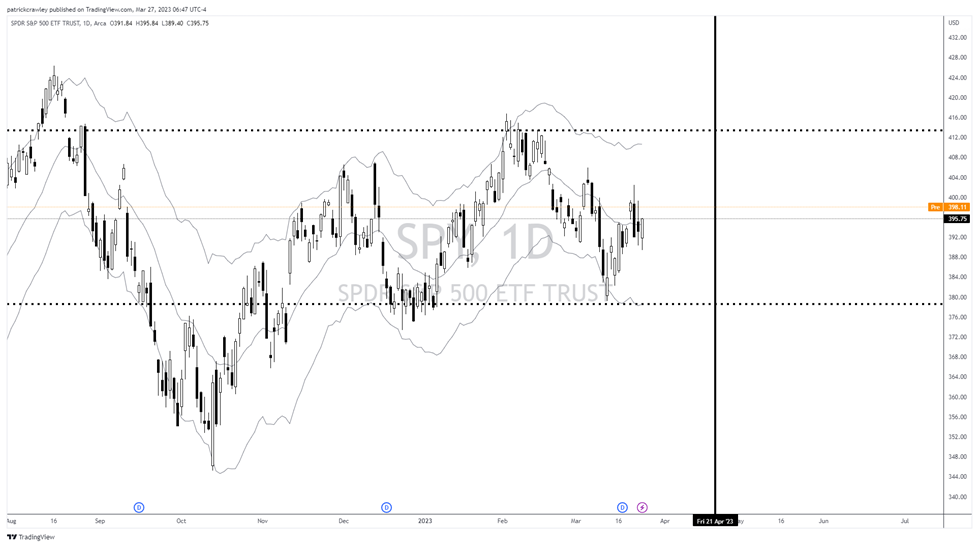
 

image.png


The thick dotted lines represent the upper and lower breakeven prices, while the vertical black link represents the expiration date. The price of SPY needs to exceed either of these levels for our hypothetical long straddle position to show a profit before expiration.


Long Straddle Maximum Profit

This one is easy. The maximum upside profit for a long straddle position is theoretically unlimited. There’s no limit to how high a stock price can go.


However, on the downside, your max profit is only limited by the stock price. Because a stock price can only go to zero, you can calculate the max profit by subtracting the total premium paid from the strike price. In this case, the strike price is $369, and the total premium paid for our SPY long straddle is $17.37, so the max profit from the stock declining is $378.63, which is the same as our lower breakeven price.


Long Straddle Maximum Loss/Risk

Because a long straddle involves buying two options, no formulas are required to calculate your maximum risk. The maximum risk for this position is the total premium paid. In our SPY straddle example, that is $17.37.


However, the absolute maximum loss in a straddle is pretty rare, as you’ll see when we show you the payoff diagram of the long straddle.
 

Long Straddle Payoff Diagram

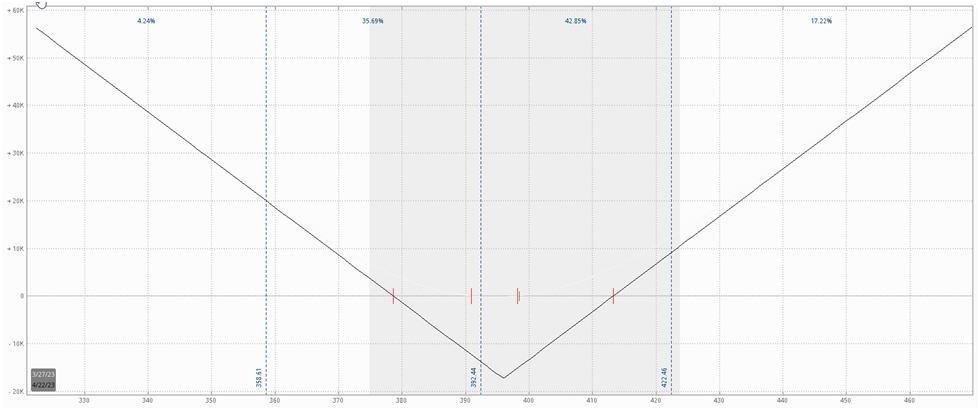
The long straddle payoff diagram is characterized by a V-shape. This is unlike the straddle’s sister spread, the strangle, which is marked by a flattened U-shape.


Here is the straddle payoff diagram:


Long Straddle: Definition, How It's Used in Trading, and Example
 

Let’s look at a real-life example of a long straddle payoff diagram, using our SPY straddle as an example.


As a reminder, here is our SPY long straddle position:

SPY Long Straddle:

  • BUY 1 396 Put @ $8.06
     
  • BUY 1 396 Call @ 9.31
     
  • Theta: -0.34
     
  • Total trade cost: $17.37 (net debit)


image.png


Long Straddle: Market View

Why Matching Your Market View to Options Trade Structure is Crucial

One thing we’re trying to nail home in this reverse straddle primer is the importance of matching your market view to the correct options spread. As an options trader, you’re a carpenter, and option spreads are your tools. If you need to tighten a screw, you won’t use a hammer but a screwdriver.


So before you add a new spread to your toolbox, it’s crucial to understand the market view it expresses. One of the worst things you can do as an options trader is structure a trade that is out of harmony with your market outlook.


This mismatch is often on display with novice traders. Perhaps a meme stock like GameStop went from $10 to $400 in a few weeks. You’re confident the price will revert to some historical mean, and you want to use options to express this view. Novice traders frequently only have outright puts and calls in their toolbox. Hence, they will use the proverbial hammer to tighten a screw in this situation.


In this hypothetical, a more experienced options trader might use a bear call spread, as it expresses a bearish directional view while also providing short-volatility exposure. But this trader can be infinitely creative with his trade structuring because he understands how to use options to express his market view appropriately.


The nuances of his view might drive him to add skew to the spread, turn it into a ratio spread, and so on.


What Market Outlook Does a Long Straddle Express?

A trader using a long straddle expects a significant increase in implied volatility and/or a significant price movement and has a neutral directional view.


Significantly, a trader who buys a straddle should have a bullish view of volatility. Buying both an at-the-money (ATM) put and call is a considerable premium outlay, so having the view that volatility is cheap isn’t enough to justify buying a straddle. You must expect a huge price move.


Furthermore, it’s essential to view volatility in relative terms. While 50% implied volatility might be very high for a stock like Philip Morris (PM), that might be historically low for a stock like Tesla (TSLA).


When To Use a Long Straddle

While there’s an infinite number of scenarios where a sophisticated options trader can profitably buy a straddle, there are two basic scenarios where it makes sense to buy a straddle.


The first is when implied volatility is at the bottom of its historical range as measured by something like IV Rank or something similar.


The second is when there’s an upcoming catalyst that you think the options market is underpricing the volatility of.


However, when it comes to event volatility, we find that it’s too hard to predict. We’d rather exploit how options markets tend to price event volatility over time rather than predict how the market will react to a blockbuster data release. We’ll demonstrate this point by discussing how we trade pre-earnings straddles.


Buying Pre-Earnings Straddles

Earnings releases are the most common form of straddle trading. Companies report earnings four times per year. A simple glance at a stock chart shows that these one-day data releases are often accountable for a large portion of the stock’s annual price range.


The typical way options traders play earnings is to identify stocks with consistently underpriced earnings volatility. These stocks change over time, as the market eventually adapts and market makers appropriately price volatility.


However, the glaring issue with earnings straddles is IV crush. As soon as the market digests the earnings report, implied volatility plummets as there’s no longer lingering uncertainty about a potentially terrible or blockbuster report.


Furthermore, there’s a heavy tendency for the market to significantly overprice earnings volatility.
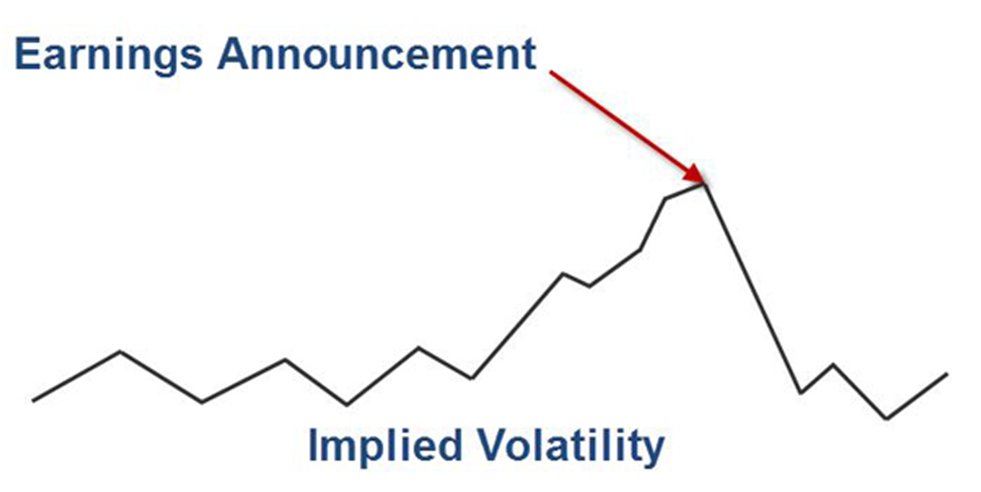
 

image.png


This is why we at SteadyOptions prefer to trade pre-earnings straddles. Because implied volatility (and, in turn, option prices) tends to rise in the lead-up to earnings, we prefer to buy straddles 2-150 days before an earnings release and sell before earnings are even released. Pre-earnings straddles also significantly reduce the main risk of the straddle strategy which is negative theta.


Rather than making a bet on earnings, we’re combining momentum trading and the tendency for implied volatility to rise in the lead-up to earnings. We’re simply exploiting a repeatable tendency in the options market. This isn’t theoretical. You can see the performance of our pre-earnings straddles on our performance page here.

We first described the strategy in our article Exploiting Earnings Associated Rising Volatility.


Using Straddles to Trade Volatility Mean Reversion

Volatility expands and contracts. If you look at a chart of volatility, you’ll realize that it seems more like an EKG or sine wave than a stock chart. For instance, as a demonstration point, let’s look at the long-term moving average of the S&P 500 Volatility Index (VIX).


The following is a 10-week moving average of the VIX going back to its formulation in 1990:
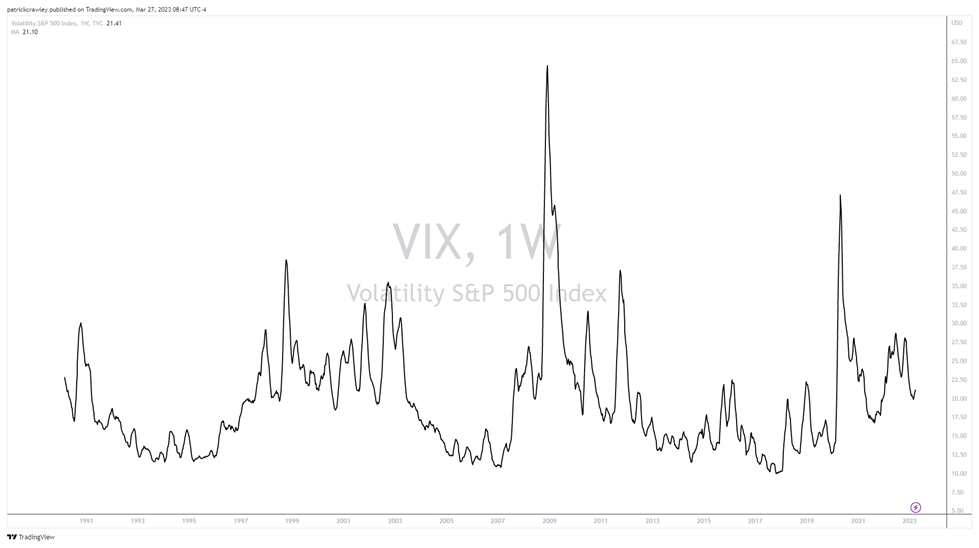
 

image.png


Pretty obvious mean-reverting behavior too. And as we mentioned earlier in this article, this phenomenon is supported by popular quantitative finance academic literature.


One way options traders might exploit this phenomenon is to opportunistically wait for periods where volatility is very low compared to its historical average. There are several ways to measure this, with IV Rank being one popular measure.


Long Straddle Options Spread Example

Here is a recent example of our straddle strategy.

DIS was scheduled to announce earnings on February 8th. We placed the following trade on February 2th:
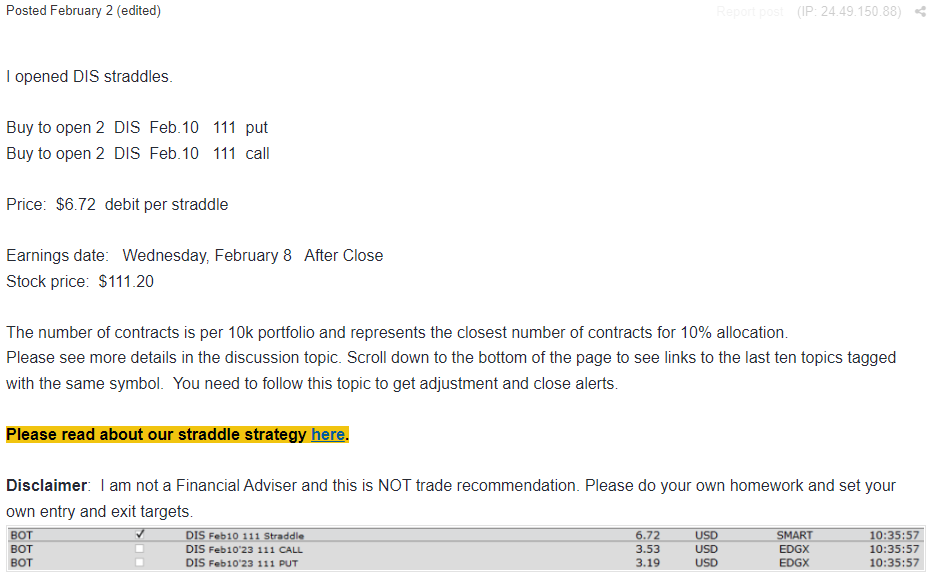
image.png

We paid $6.72 for the 111 straddle using options expiring on Feb.10 (2 days after earnings).

3 hours later we were able to close the trade at $7.40 for 10.12% gain.
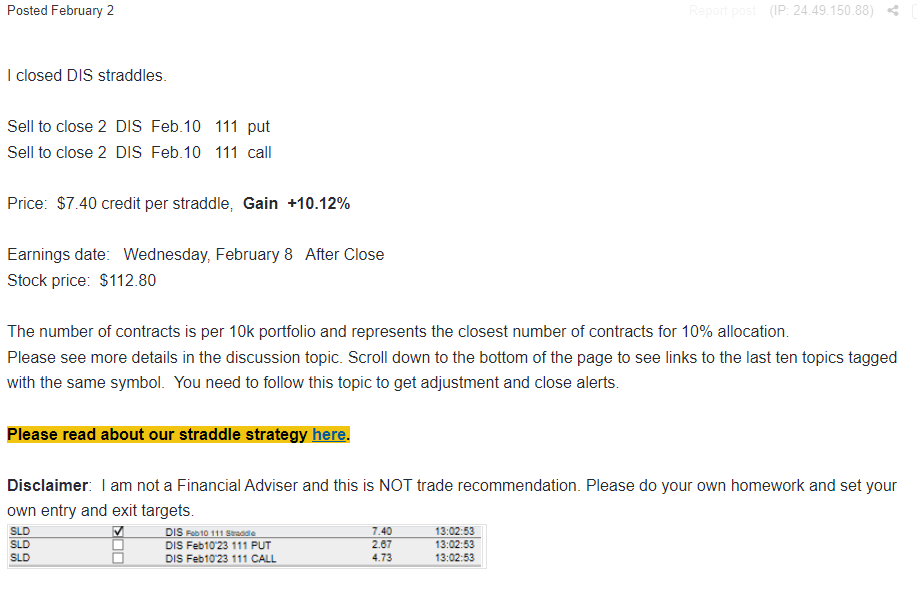
image.png

The trade benefited from the stock movement and IV increase.
 

The Biggest Risk When Buying a Long Straddle

Most people buy straddles to participate in event volatility. They’re betting that the options market is underpricing the risk of a significant price move in either direction.


But everyone in the market knows that this event is coming. Because the event is a source of considerable uncertainty, implied volatilities in the post-event expirations tend to rise significantly as we get closer to the event.


However, implied volatility tends to plummet once the event is behind us and the market has digested the consequences. This is IV Crush, an effect we’ve already discussed in this article.


But it’s a point that deserves to be driven home. Several backtests show that, on average, holding straddles through earnings (the most popular form of event volatility) is an unprofitable strategy. While there’s no doubt that some traders can pick and choose their straddles wisely enough to create a profitable strategy for themselves, we prefer to play the probabilities.


Instead, we exploit the tendency for earnings volatility to get more expensive in the lead-up to the event. However, instead of holding through the earnings release, we choose to sell before it.

The strategy of buying straddles 2-15 days before earnings and selling before the event is our bread and butter strategy. It can produce 5-10% gain in a short period of time with a very limited risk and also serve as a black swan protection because the gains will be very large in case of a black swan event.


Bottom Line

The long straddle is a simple option spread. You buy a put and call at the same strike price and expiration. But simple doesn’t mean easy.


The bottom line is that the straddle is a bet on significant change. A trader buying a long straddle is betting on the stock’s price making a sizeable directional price move or that the options market will significantly raise the price of volatility.

The following Webinar discusses different aspects of trading straddles.


Like this article? Visit our Options Education Center and Options Trading Blog for more.

Related articles


There are benefits to delta-neutral trading. One of the primary benefits is that it can help you minimize your risk. By hedging your portfolio against directional risk, you can reduce the impact of market fluctuations on your portfolio. Additionally, delta-neutral trading can help you take advantage of opportunities in the market without taking on too much risk.
 

What is Delta Neutral Trading?

There are a few key components to delta-neutral trading. First, you need to understand delta. Delta is a measure of the change in the price of an option relative to the change in the price of the underlying asset. A delta-neutral portfolio has a delta of zero, which means that the portfolio is not affected by changes in the price of the underlying asset.


Another key component of delta-neutral trading is gamma. Gamma is a measure of the rate of change of delta with respect to changes in the price of the underlying asset. A gamma-neutral portfolio has a gamma of zero, which means that the portfolio’s delta is not affected by changes in the price of the underlying asset.


One common mistake that traders make when trying to create a delta neutral position is using the wrong trade structure. Many traders use traditional premium selling trade structures, which can be highly directional and cause significant losses due to large delta adjustments when an underlying changes direction. When the underlying price changes direction in a back-and-forth manner and continuous adjustments are made with every move it causes directional whipsaws. These inefficiencies can cause losses on whipsaw, just like in directional trading.


While traders are trying to profit from Theta, they are locking in losses on direction. These losses can frequently outpace the Theta decay that was expected from the trade, requiring traders to make up for those losses over time. Therefore, it is important to slow down and diagnose the real problem before trading structures that require large and frequent delta adjustments.


Adjusting a position using delta hedging is different than using delta hedging to open and close positions. Some trade structures require legging in to establish and legging out to exit. Opening or closing a position is the time to use large delta hedging techniques as a temporary fix to large delta swings when legging into and out of positions.


On February 6th, 2018, I experienced losses due to neglecting delta-neutral concepts while exiting my options positions. The previous day’s market crash had caused significant losses in my portfolio, but I was pleased to see a $50,000 increase in its value. However, in my haste to take advantage of this turn of events, I closed all positions quickly without considering delta risk. As I was not using single ticket orders, I had to leg out of positions, and as I closed one position, the others became directional. Despite believing that I could close my positions fast enough to avoid significant directional losses, I ended up with a net liquidation value that was -$80,000, which was devastating. This $130,000 swing was solely due to my lack of attention to delta neutrality while legging out of positions.


As you can see proper delta neutral trading is important as you can take significant losses when bad trade structures are used that force too many adjustments, too large of adjustments or legging in and out. Traders should always consider the correct way to use delta neutral trading. In order to properly use delta-neutral trading and adjustments, traders need the proper trade structure and a trade plan that focuses on gamma neutrality and super low delta swings along with single ticket orders to avoid directional legging risk. This allows traders to make low-delta adjustments and minimize the need for frequent adjustments, reducing the risk of locking in losses.


Seek Education and Training

Even advanced options traders may not know enough to properly use delta neutral strategies properly. Therefore, seeking out education and training from a high-level experienced trader can be critical.


Numerous trading platforms provide educational resources on options trading, including delta-neutral trading. However, it’s crucial to exercise caution regarding the trade structures used. If the structure is a commonly used one, such as iron condors, spreads, or symmetrical butterflies, it may be wise to reconsider. Instead, there are more advanced and relatively unknown options trading structures available that can safeguard against the potential hazards of delta-neutral trading.


Traders should regularly monitor their positions to ensure that they remain gamma-neutral and have super low delta swings. This means analyzing their options portfolio on a regular basis, using tools like delta, gamma, and Theta to track changes in their positions.


Additionally, traders should have a plan in place for how to handle their remaining positions if adjustments need to be made. By monitoring their positions regularly, traders can stay on top of changes in delta and make adjustments as needed to minimize their risk and increase their chances of success.


Additionally, traders can seek out mentorship or coaching from experienced traders who specialize in advanced options trading. These individuals can provide valuable insights and advice on delta-neutral trading, as well as offer personalized feedback on a trader’s specific approach to the strategy.


By seeking out education and training, traders can improve their knowledge and skills in delta-neutral trading and increase their chances of success.


Conclusion

Delta-neutral trading can be an effective way to minimize directional risk and profit from Theta in the options market. However, there are some common pitfalls that traders need to be aware of in order to avoid losing money. By slowing down, diagnosing the real problem, considering delta risk, using a proper trade structure and plan, and seeking education and training, traders can minimize their risk and increase their chances of success in delta-neutral trading.


Ultimately, the key to success in delta-neutral trading is having a solid trade structure and trade plan. By following these tips and best practices, traders can improve their knowledge and skills in delta-neutral trading and maximize their profit potential in the options market.


About the Author: Karl Domm’s 29+ years in options trading showcases his ability to trade for a living with a proven track record. His journey began as a retail trader, and after struggling for 23 years, he finally achieved 
consistent profitability in 2017 through his own options-only portfolio using quantitative trading strategies.

After he built a proven trading track record, he accepted outside investors. His book, “A Portfolio for All Markets,” focuses on option portfolio investing. He earned a BS Degree from Fresno State and currently resides in Clovis, California. You can follow him on YouTube and visit his website real-pl for more insights.

Related articles:


For example: You see a credit spread with a market of $1.00 bid and $1.60 ask. There is little chance of selling the spread and collecting $1.45 or $1.50 (unless the price of the underlying asset changes). To achieve that price, there would have to be a buy order for the spread you are selling; the order would almost certainly have to originate from a retail trader; and your offer would have to be the lowest available price. That’s quite a long shot.


For the most part, we have to trade with market makers. However, if the options we trade are very active, it is quite possible (don’t expect it to happen very often) that one customer may bid for the option we want to sell while another is offering the option we want to buy. When that happens, our broker’s computer should be able to spot the bid and offer and almost instantaneously trade with both orders to complete your trade at a favorable price. That’s the theory. In practice it would require that both orders be present simultaneously and that neither order is good enough to get filled immediately, and that there is no other order (similar to yours) that could grab those two option orders before your broker’s computer can act. That’s asking quite a bit.


The point is that trading is not cheap. Every time we enter an order we must expect some slippage (getting orders filled at a price that is worse than the midpoint). If we assume the middle price—between the bid and as— is a fair price, then almost every trade is going to be worse than that fair price. Because that happens we cannot afford to trade too frequently. NOTE: Do not refuse to make an important trade just to avoid slippage.


When we use income-generating strategies, we earn money through positive theta (time decay). We overcome that slippage by holding on to our trades. It is important to recognize a potential mindset error:  We are not entitled to time decay profits. When we hold any position, the market may not behave. We may wait for theta to come our way, but we could lose far more money than theta provides. Waiting is not without risk.


We cannot ignore this risk and must apply our risk management skills as needed. We hold positions when they are working, risk is within our comfort zone, and there is no other compelling reason to adjust or exit the position. That is how theta is collected—by taking risk. It is not something that just drops into our bank account.


Technical analysis

When using technical analysis to make entry and exit decisions, the trading game is all about timing. Non-option traders may exit a trade within seconds or minutes. Slippage prevents (or extremely limits) the probability of being able to grab a quick profit when trading options.

With the type of strategies (‘income-generating’) that I most often recommend, we take into consideration special items that are of no interest to the short-term equity trader:

  • Is the implied volatility high or low?
     

    • In either situation, we plan to hold the position until IV reverts to the mean (Moves back near its average level). The equity trader wants the stock to change price and option premium levels are of no importance
       
  • Has the market been volatile or calm over the recent past?
     

    • The success of our strategy may depend on volatile or calm markets. The equity trader looks only for the predicted price change
       

·         Is the market trending higher or lower?
 

o    If following a trend, the usual plan is to hold, allowing the trend to work
 

  • Is any major news event overhanging the market?
     

    • You may prefer to exit prior to that news release


  • Do you have too much delta, gamma, theta or vega risk?
     

    • Risk is measured by the Options Greeks. When any specific risk factor is too high for comfort, reduce that risk
       

When a trader anticipates a decent-sized market move over the very short-term, and if she wants to make a bet on the direction of that move, the best play is to own an in-the-money put or call option, with the premium as low as possible (in case she is wrong). There is no reason to buy or sell a spread with its embedded slippage.


NOTE: If a trader makes this play because news is pending, expect option prices to be high. When ‘everyone’ knows that news is coming, options are in demand (lots of buyers, fewer sellers), and prices move higher. When it is known that a price gap is more likely than usual, options become attractive for the speculator—despite the higher-than-normal premium. Be cautious when making a bullish or bearish play (buying single options) under these conditions. Spreads are almost always a better value, even though profits are limited. Under those conditions, it is appropriate to trade a credit or debit spread because it has less vega. We buy options with premium, but sell other options. Net vega is reduced.


Conclusion

Never delay a needed adjustment or exit because of trading costs. Slippage is part of the cost of doing business. This does not mean the winning trader pays the ask price or sells the bid price. She still tries to get a reasonable trade execution, but knows in advance that she will incur some slippage cost when trading.
 

  • It is good practice to be aware of the cost of trading (commissions, slippage)
     
  • Part of the time a trade should be avoided because the profit potential (after commissions) is too small
     
  • NEVER be concerned about trading expenses when the position is outside your comfort zone.Risk management comes first. Use common sense or the Greeks to get a handle on what can go wrong with the position.
     

This post was presented by Mark Wolfinger and is an extract from his book The Option Trader’s Mindset: Think Like a Winner. You can buy the book at AmazonMark has been in the options business since 1977, when he began his career as a floor trader at the Chicago Board Options Exchange (CBOE). Mark has published seven books about options. His Options For Rookies book is a classic primer and a must read for every options trader. Mark holds a BS from Brooklyn College and a PhD in chemistry from Northwestern University.

Related articles